It's all over at last. Election 2024 has been and gone and now we must dive into the results to find out what happened, how it happened, and what happens next.
Firstly, the scale of the Labour landslide should not be underestimated. Their majority of 172 is only five short of Tony Blair's majority of 177 in 1997, and bigger than the 2001 Blair landslide of 165. It is also the Conservatives' worst result since their formation in the 1830s, and if you care to go back that far, since 1761 when they were the Tories.
So, we all know what we're here for. Stats, percentages, swings, gains, losses, you know the drill.
Swingometer time.
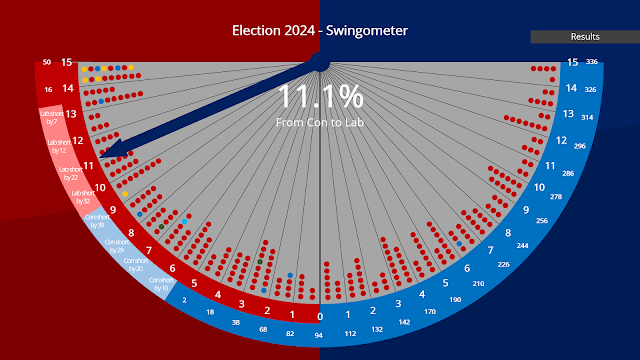
The first thing to note straightaway is that the swing does not show a Labour majority, let alone a landslide. However, when you look at the regional picture we get a slightly clearer outcome.

(That took far too long to make. Thanks Rishi for calling the election before I was ready.)
That isn't an error by the way - there were no Conservative/Labour marginals in Scotland! As you can see we've actually run out of swing on our regional swingometer, so the figures have been added in parentheses
As you can see, the large amount of marginals in the North, Midlands, and South helps Labour as they achieved a higher swing in these regions. They comparatively did pretty badly in Wales and London (especially in the case of the capital) but the simple fact is this: they didn't need big swings in Wales and London. The efficiency of the Labour vote was extraordinary, and indeed in many of these seats the Reform effect did help.
But for Labour the issue was where they had strong independent challenges. For a party that won 410 seats, their vote share dropped in 226 seats out of 631 we are looking at, an extraordinary number. By contrast, in 2019, the Conservative vote share dropped just in just 136 seats - and they won 55 fewer seats.
There may be some tactical voting at work here too. The average change in the Labour vote where the seat result was a LD Gain from Con was -2.5%.

Another casualty of the early election for me was the fact I only did 160 target seats for the parties. Labour's attack have turned this board almost entirely red, hitting 149 of their top 160 targets.


I will segue at this point to the SNP collapse, as it also ties in to the Labour story.


As you can see, Labour gained almost everything the SNP held in Scotland. There was a swing in Scotland of 15.8% from the SNP to Labour, enough to wipe them out almost entirely. Indeed, the only SNP successful defences came where they were fighting the Conservatives principally (they even made one gain from the Conservatives).
As you can see from this board, Labour's 10 biggest vote share increases were all "Lab gain from SNP" seats north of the border. But as you can see their 10 biggest drops all featured a major independent candidate which siphoned off Labour votes for the most part.
 |
| (This is by party, so I am treating Islington North re Jeremy Corbyn as a "new" candidate rather than directly comparable with the 2019 Labour vote.) |
It has been suggested that most of these seats feature heavily Muslim populations, but the Census data by Parliamentary data by religion is not easily sortable and difficult to analyse, so would require a huge amount of technical jiggery-pokery to ascertain the accuracy of this. If true, however, we are possibly ushering in a worrying era of sectarianism in elections. Indeed, this is what MRP polling is all about; profiling a seat by its demographics and polling each demographic as to their voting intention. But that is for another time. If I were doing a paper at University, or another dissertation, or a Masters, I would seriously like to look into this further. It is my intention to do some more work on this in the future, but this would require a huge amount of time to sift through the data. So I invite anyone reading this to do that analysis and share it with me.
As you can see on the board, four of the five biggest drops in the Conservative vote were seats where Reform gained from them (the missing one here is Ashfield, which was a three-way marginal in 2019 between the Conservatives, Labour, and an Independent). It is at this point I declare my interest as one of my friends worked for the defeated MP for Clacton so I cannot help but shed a tear or two - as well as some major embarrassment when I point out they did the worst of any Conservative in the country...
It is very hard for us to ascertain Reform's performance given they didn't stand in many seats in 2019. Thus, most of their biggest vote share gains are where they did not stand, such as Clacton, and thus were coming from 0.0% (although this is affected by boundary changes so is difficult to work out). Their average change in vote share in seats they stood in both 2024 and 2019 is +10.5%. Just a bit of fun, but if we take that and apply it to the 2019 seats where they did not stand (2024 vote share - 10.5%) to "predict" their vote shares (back of a fag packet stuff here because I haven't even taken regionalisation into account), in 2019 there is only one seat where the "theoretical" Reform vote was bigger than the majority (Canterbury, which was a Labour hold at that election). The Conservatives cannot therefore claim the comparative lack of Reform inflated their majority in 2019.
Adding together the Conservative and Reform votes would have garnered an extra 176 seats between them, thus winning 302 seats - still not enough to govern. Now, that is a massive oversimplification, and there is no guarantee (in fact, I would suggest there is an impossibility) of all of these voters combining forces. Of a greater worry for the Conservatives is where they were hurt by the Liberal Democrats. Not since 1924 have the Conservatives won a majority when the Liberal Democrats (or their predecessors) have scored 40 or more MPs, and the Lib Dems' results of 72, their best since 1923 when Asquith scored 158 seats, was the nail in the Conservative coffin. Although tactical voting by Labour supporters did play a part (outlined above) my model still predicted 53 seats for them. It is clear that the Conservatives must recapture these lost Lib Dems seats at the next election.


And now we've come to the moment that I suspect many of you clicked on this for: the Conservative wipeout - and the PowerPoint slide dump.
The Conservative defence board makes for grim reading for Conservatives. It is, of course, very similar to the Labour board attack, but also shows their failure to protect against the Liberal Democrats too. Not a single successful defence against anyone is mounted in the third column. And these are seats 65-96! Had I had time to do a page two, it would have been even more galling for the Conservatives. Indeed, two pages wouldn't even have been enough to show all the losses. The losses which would have necessitated a third page are Lichfield (Lab gain; Con defence 321), Tamworth (Lab gain; Con defence 325), Waveney Valley (Grn gain; Con defence 326), Sittingbourne & Sheppey (Lab gain; Con defence 334), Honiton & Sidmouth (LD gain; Con defence 336), Herefordshire North (Grn gain; Con defence 344), Norfolk South West (Lab gain; Con defence 360), Clacton (Ref gain; Con defence 364), and Boston & Skegness (Ref gain; Con defence 371). The Conservatives had 372 on the new boundaries for 2019 if you're wondering why they're defending more seats than they won at the time.


There are two other things to now look at: the performance of the "Benjamin model" which was pretty much on the nose in 2019, and Proportional Representation.
No model would have been likely to predict these seats falling, unless they included constituency-level polling. The safest seats to fall, ranked by their swing required to be lost:

Like any half-decent psephologist, I developed my own way of analysing the election results. This does not mean I am a predictor, it means I translate polls and votes into seats theoretically. My methodology is very similar to the exit poll prior to 2015, and uses regional breakdowns of votes to apply the regional swings to each seat in turn. This isn't that accurate, but then again neither is any system.
The only way to test the model, therefore, is to use the actual election results in terms of votes, and see what that would yield in terms of seats won. In other words, as though the actual election results was like an opinion poll, done by region as per my methodology. So... what do we come up with?
Headline figures (Benjamin model): LAB 326 (-85), CON 230 (+109), LD 53 (-19), SNP 17 (+7), PC 4 (nc), GRN 1 (-3), REF 0 (-5).
Woah. That's pretty far out. Now, in 2019, I got 595 out of 632 correct and with a further 17 within a 2% swing. This election was always going to be tougher to predict, in part down to the Independents outperforming some expectations. My model still got 497 seats correct (79%), so I'm not going to throw it out yet. Now, of the 135 I got wrong, 51 were within the margin of error (a 2% swing), so that still leaves 84 outliers. I am not going to list seats where an Independent won as the model cannot, and would not have been expected, to predict them.
Unlike in 2019, I am not going to take up column inches with a seat-by-seat guide to the 84, but I will deal with them in sections here:
Scotland:
- Aberdeenshire North & Moray East (our forecast: Con hold; actual result: SNP Gain from Con)
- Alloa & Grangemouth (our forecast: SNP hold; actual result: Lab gain from SNP)
- Falkirk (our forecast: SNP hold; actual result: Lab gain from SNP)
- Inverness, Skye, and West Rossshire (our forecast: SNP hold; LD gain from SNP)
- Stirling and Strathallan (our forecast: SNP hold; Lab gain from SNP)
North:
- Blackpool North & Fleetwood (our forecast: Con hold; actual result: Lab gain from Con)
- Bolton West (our forecast: Con hold; actual result: Lab gain from Con)
- Carlisle (our forecast: Con hold; actual result: Lab gain from Con)
- Congleton (our forecast: Con hold; actual result: Lab gain from Con)
- Keighley & Ilkley (our forecast: Lab gain from Con; actual result: Con hold)
- Morecambe & Lunesdale (our forecast: Con hold; actual result: Lab gain from Con)
- Northumberland North (our forecast: Con hold; actual result: Lab gain from Con)
- Pendle & Clitheroe (our forecast: Con hold; actual result: Lab gain from Con)
- Penrith & Solway (our forecast: Con hold; actual result: Lab gain from Con)
- Ribble Valley (our forecast: Con hold; actual result: Lab gain from Con)
- Selby (our forecast: Con hold; actual result: Lab gain from Con)
Well done Robbie Moore! Everything else is simply Labour outperforming the swing, with the exception of Selby, which was gained in a by-election and thus the incumbent there was actually Labour.
Midlands:
- Amber Valley (our forecast: Con hold; actual result: Lab gain from Con)
- Ashfield (our forecast: Lab gain from Con; actual result: Ref gain from Con)
- Boston & Skegness (our forecast: Con hold; actual result: Ref gain from Con)
- Cannock Chase (our forecast: Con hold; actual result: Lab gain from Con)
- Derbyshire Dales (our forecast: Con hold; actual result: Lab gain from Con)
- Derbyshire South (our forecast: Con hold; actual result: Lab gain from Con)
- Dudley (our forecast: Con hold; actual result: Lab gain from Con)
- Herefordshire North (our forecast: Con hold; actual result: Grn gain from Con)
- Kettering (our forecast: Con hold; actual result: Lab gain from Con)
- Leicester East (our forecast: Lab hold; actual result: Con gain from Lab)
- Leicestershire North West (our forecast: Con hold; actual result: Lab gain from Con)
- Lichfield (our forecast: Con hold; actual result: Lab gain from Con)
- Mansfield (our forecast: Con hold; actual result: Lab gain from Con)
- Redditch (our forecast: Con hold; actual result: Lab gain from Con)
- Shropshire North (our forecast: Con hold; actual result: LD gain from Con)
- Stoke-on-Trent South (our forecast: Con hold; actual result: Lab gain from Con)
- Stourbridge (our forecast: Con hold; actual result: Lab gain from Con)
- Stratford-on-Avon (our forecast: Con hold; actual result: Lab gain from Con)
- Tamworth (our forecast: Con hold; actual result: Lab gain from Con)
- Warwickshire North and Bedworth (our forecast: Con hold; actual result: Lab gain from Con)
- Wellingborough & Rushden (our forecast: Con hold; actual result: Lab gain from Con)
Two of my Parliamentary staff friends will loathe this. Sorry! Ashfield was a huge outlier as the Conservative majority was so small it was almost destined to be a Labour gain but Lee Anderson did a good job there to give Reform a gain. Boston & Skegness, as outlined above, was an incredibly safe seat and it was unlikely to have fallen. The only thing was the lack of Reform candidate in 2019, meaning it was difficult to establish just how safe it was. Some more by-election and independent madness in Leicester East, Shropshire North, Tamworth, and Wellingborough & Rushden.
Wales:
- Monmouthshire (our forecast: Con hold; actual result: Lab gain from Con)
- Montgomeryshire & Glyndwr (our forecast: Con hold; actual result: Lab gain from Con)
Montgomeryshire & Glyndwr saw a huge 20.1% swing from Conservative to Labour, compared to a theoretical swing in Wales of 7.1%. What on earth happened there!?
London:
- Bexleyheath & Crayford (our forecast: Con hold; actual result: Lab gain from Con)
- Chelsea & Fulham (our forecast: Con hold; actual result: Lab gain from Con)
- Cities of London & Westminster (our forecast: Con hold; actual result: Lab gain from Con)
- Finchley & Golders Green (our forecast: Con hold; actual result: Lab gain from Con)
- Sutton & Cheam (our forecast: Con hold; actual result: LD gain from Con)
- Uxbridge & Ruislip South (our forecast: Con hold; actual result: Lab gain from Con)
As noted above in the big Lib Dem drops, three of these seats (Chelsea & Fulham, Cities of London & Westminster, and Finchley & Golders Green) had strong Lib Dem challenges in 2019 but this time they fell away - the three biggest Lib Dem drops in the country - and (tactically?) switched their allegiances to Labour. The hotly-contested Uxbridge & Ruislip South by-election in 2023 reduced this majority heavily and thus people may have voted differently at the general election to how they would have done had there not been a by-election the previous year.
South:
- Aldershot (our forecast: Con hold; actual result: Lab gain from Con)
- Ashford (our forecast: Con hold; actual result: Lab gain from Con)
- Basildon South & Thurrock East (our forecast: Con hold; actual result: Ref gain from Con)
- Bracknell (our forecast: Con hold; actual result: Lab gain from Con)
- Bristol Central (our forecast: Lab hold; actual result: Grn gain from Lab)
- Bury St Edmunds & Stowmarket (our forecast: Con hold; actual result: Lab gain from Con)
- Cambridgeshire North West (our forecast: Con hold; actual result: Lab gain from Con)
- Chatham & Aylesford (our forecast: Con hold; actual result: Lab gain from Con)
- Chesham & Amersham (our forecast: Con hold; actual result: LD gain from Con)
- Chichester (our forecast: Con hold; actual result: LD gain from Con)
- Clacton (our forecast: Con hold; actual result: Ref gain from Con)
- Cornwall South East (our forecast: Con hold; actual result: Lab gain from Con)
- Dartford (our forecast: Con hold; actual result: Lab gain from Con)
- Dorset South (our forecast: Con hold; actual result: Lab gain from Con)
- Forest of Dean (our forecast: Con hold; actual result: Lab gain from Con)
- Gillingham & Rainham (our forecast: Con hold; actual result: Lab gain from Con)
- Godalming & Ash (our forecast: LD gain from Con; actual result: Con hold)
- Gravesham (our forecast: Con hold; actual result: Lab gain from Con)
- Great Yarmouth (our forecast: Con hold; actual result: Ref gain from Con)
- Hampshire North East (our forecast: Con hold; actual result: LD gain from Con)
- Honiton & Sidmouth (our forecast: Con hold; actual result: LD gain from Con)
- Horsham (our forecast: Con hold; actual result: LD gain from Con)
- Isle of Wight West (our forecast: Con hold; actual result: Lab gain from Con)
- Maidenhead (our forecast: Con hold; actual result: LD gain from Con)
- Norfolk South West (our forecast: Con hold; actual result: Lab gain from Con)
- Poole (our forecast: Con hold; actual result: Lab gain from Con)
- Portsmouth North (our forecast: Con hold; actual result: Lab gain from Con)
- Reading West & Berkhire Mid (our forecast: Con hold; actual result: Lab gain from Con)
- Rochester & Strood (our forecast: Con hold; actual result: Lab gain from Con)
- Sittingbourne & Sheppey (our forecast: Con hold; actual result: Lab gain from Con)
- Tewkesbury (our forecast: Con hold; actual result: LD gain from Con)
- Tiverton & Minehead (our forecast: Con hold; actual result: LD gain from Con)
- Waveney Valley (our forecast: Con hold; actual result: Grn gain from Con)
- Witney (our forecast: Con hold; actual result: LD gain from Con)
So this is where the model let us down a bit, especially in the South East! Some by-election and Reform madness as outlined above again (Basildon South & Thurrock East, Chesham & Amersham, Clacton, Great Yarmouth, Honiton & Sidmouth, Tiverton & Minehead).
And finally - proportional representation...
Under PR using Regional Party List, the only method by which we can ascertain results due to not knowing transferable votes (obviously), we get the following:
Scotland: CON 7, LAB 21, LD 5, REF 4, GRN 2, SNP 18
North East: CON 6, LAB 13, LD 1, REF 6, GRN 1
North West: CON 14, LAB 33, LD 5, REF 12, GRN 5 (+3 for "others")
Yorkshire: CON 12, LAB 23, LD 4, REF 9, GRN 4 (+2 for "others")
East Midlands: CON 14, LAB 17, LD 3, REF 9, GRN 3 (+1 for "others")
West Midlands: CON 16, LAB 20, LD 5, REF 11, GRN 3 (+2 for "others")
Wales: CON 6, LAB 13, LD 2, REF 5, GRN 1, PC 5
London: CON 16, LAB 33, LD 8, REF 6, GRN 7 (+5 for "others")
East Anglia: CON 19, LAB 18, LD 8, REF 11, GRN 4 (+1 for "others")
South East: CON 28, LAB 23, LD 20, REF 13, GRN 6 (+1 for "others")
South West: CON 17, LAB 14, LD 15, REF 8, GRN 4
Total: CON 155, LAB 228, LD 76, REF 94, GRN 40, SNP 18, PC 5, OTH 15
Unlike in 2019 it is hard to know what to do with the "others" (because there weren't any others winning seats under this system in 2019). If we exclude them from the House altogether you now need just 318 seats to win a majority.
That's still one very messy hung Parliament. Of course it would depend entirely on what the Lib Dems want to do, but one cannot imagine them joining another coalition any time soon. A Labour/Green/SNP/PC coalition gives 291, whilst a Conservative/Reform coalition gives 249. The Lib Dems would have to jump in with that incredibly busy coalition on the Left, giving that bloc 367 seats and a majority of 84 (with a 326 threshold). But of course then the Green/SNP/PC bloc, who have campaigned together in the past, could collapse that government at any time... Like it or not, First Past The Post did its job and we have a strong and stable government that we would not have had under PR.
I am of course open to any questions.